The present study evaluates a production unit of the Optoma HD25-LV projector. Illuminance and contrast ratio measurements were performed on this system according to IEC 61947-1:2002.
PERFORMANCE SUMMARY:
The projector excluded the screen produces light output (illuminance) of 2037 ANSI lumens at 1080p and contrast ratio of 331:1
 |
| Fig. 1 - Optoma HD25-LV |
I provide below a description and details of the setup procedures used to prepare the proyector for measurements according to ANSI .
- Section 2 presents the test requirements.
- Section 3 shows the measurement setup.
- Section 4 provides the instruments to be used.
- Sections 5 and 6 results and conclusions.
1. GENERAL PRODUCT DETAILS
- The Optoma HD25-LV delivers outstanding high-definition 1080p video and graphics.
- According to manufacturer the HD25-LV has 3500 ANSI lumens and 20,000:1 contrast ratio.
2. TEST REQUIREMENTS
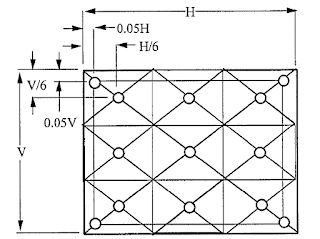
Projector and measurement test setups were according to IEC 61947-1.
Pattern used:
Projector and measurement test setups were according to IEC 61947-1.
Pattern used:
 |
| Fig. 2 - White test pattern specification |
For test purposes readers can download the figures 3 and 4 ready for 1080 in aspect ratio 16/9 to test their systems.
 |
| Fig. 3 - White test pattern |
 |
| Fig. 4 - Contrast pattern |
3. TEST SETUP
The projection system was setup according to the figure 5.
- Projection distance (D): 3.40 meters approximated.
- Screen width (W): 2.245 m
- Screen height (H): 1.265 m
- Area (W*H): 2.84 m2
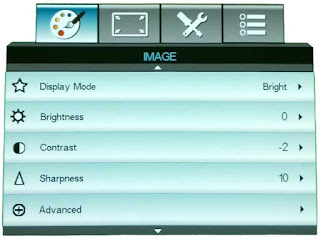
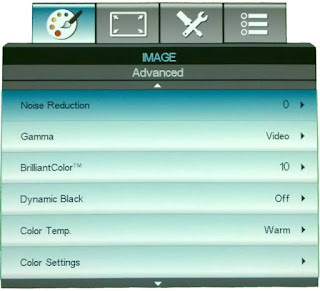
Brightness and contrast controls were adjusted to achieve visually distinguishable steps of a gray scale pattern (figure 6). Lamp mode was configured to maximum power. Other adjustments were made as indicated in figures from 7 to 10.
 |
| Fig. 6 - Gray scale step 8 |
Software projector configuration was as indicated in the following figures.
The screen illuminance were measured with a light meter. The sensor was placed on the plane of the focused image at the centre of each of nine points indicated in the figure 11. In this case, illumination sensor was placed on axis with the projector light ray in order to correct the cosine effect and maximize the flux entry into the sensor as indicated in figure 11.
 |
| Fig. 7 - Display configuration |
 |
| Fig. 8 - Image configuration |
 |
| Fig. 9 - Advance image configuration |
 |
| Fig. 10 - Color space configuration |
The screen illuminance were measured with a light meter. The sensor was placed on the plane of the focused image at the centre of each of nine points indicated in the figure 11. In this case, illumination sensor was placed on axis with the projector light ray in order to correct the cosine effect and maximize the flux entry into the sensor as indicated in figure 11.
Instruments used in these test include:
- Illumination meter DX-200
 |
| Fig. 12 - Illumination meter |
5. DATA AND RESULTS
5.1 ILLUMINANCE
The average of the nine (points 1 to 9 in figure 3) readings in lux (lumens per square metre) was multiplied by the number of square metres covered by the image at the plane of the meter readings. The result was taken as the light output of the projector, in lumens.
Based on the measurements taken, illuminance measured according to the ANSI procedure yielded a 9-point average of 2037 ANSI lumens with a variation of 13.6 % greater than average, and -41.3 % less than average for the thirteen ANSI screen locations shown in figure 13.
Note: It has to be emphasize that at the time of this test, the life of the lamp was 160 hours.
5.2 CONTRAST RATIO
 |
| Fig. 13 - Optoma HD25-LV illuminance test IEC 2002 |
Based on the measurements taken, illuminance measured according to the ANSI procedure yielded a 9-point average of 2037 ANSI lumens with a variation of 13.6 % greater than average, and -41.3 % less than average for the thirteen ANSI screen locations shown in figure 13.
Note: It has to be emphasize that at the time of this test, the life of the lamp was 160 hours.
5.2 CONTRAST RATIO
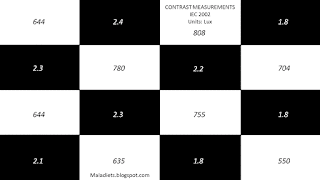
Contrast ratio is the ratio of higher illuminance to lower illuminance. Illuminance measurements in lux was made at the centre of each of the bright (white) rectangles and the dark (black) rectangles. The average illuminance value of the bright rectangles was divided by the average illuminance value of the dark rectangles. The contrast ratio was then expressed as this ratio:1 (e.g. bright rectangles with an average value of 15 lx and dark rectangles with an average value of 0,10 lx provide a contrast ratio of 150:1).
Illuminance was measured in both horizontal and vertical directions at 16 screen positions for white and black rectangular targets simultaneously displayed in a 4 x 4 chess board configuration as specified by ANSI IT7.215.
Illuminance was measured in both horizontal and vertical directions at 16 screen positions for white and black rectangular targets simultaneously displayed in a 4 x 4 chess board configuration as specified by ANSI IT7.215.
 |
| Fig. 14 - Optoma HD25-LV contrast ratio test IEC 2002 |
6. CONCLUSIONS
- The collected data reveals a clear difference between the manufacturer data and the test results.
- There is a clear discrepancy between the manufacturer illuminance (3000 lumens) and the data obtained (2037 lumens).
- The same clear discrepancy is observed between the manufacturer contrast ratio (20000:1) and the data obtained (331:1). However, it has to be empathized that for this measurement, dynamic black was setted to off.
Seeing those data, we can scold Optoma for their advanced “optimism” (or total lack of reality) but the bottom line is that roughly 2000 measured lumens is a lot of lumens, and makes this a projector that can tackle many family rooms and living rooms while providing a good picture.


No hay comentarios:
Publicar un comentario